Status: Ongoing
Associated with: Thynk360
Public opinion drives everything from product success to political campaigns. As part of Thynk360’s vision to harness AI for real-time insights, I am developing an Opinion Mining Dashboard—a web-based sentiment analysis tool that captures and visualizes user sentiment from textual content like product reviews, tweets, and news comments. It serves as an intuitive decision support system for understanding audience reactions across various domains.
Tools & Technologies Used
- Programming Language: Python
- Libraries: VADER (Valence Aware Dictionary and sEntiment Reasoner), NLTK, Streamlit, Plotly, Pandas
- Visualization: Interactive charts with Plotly
- Deployment: Streamlit for real-time user interface
Description
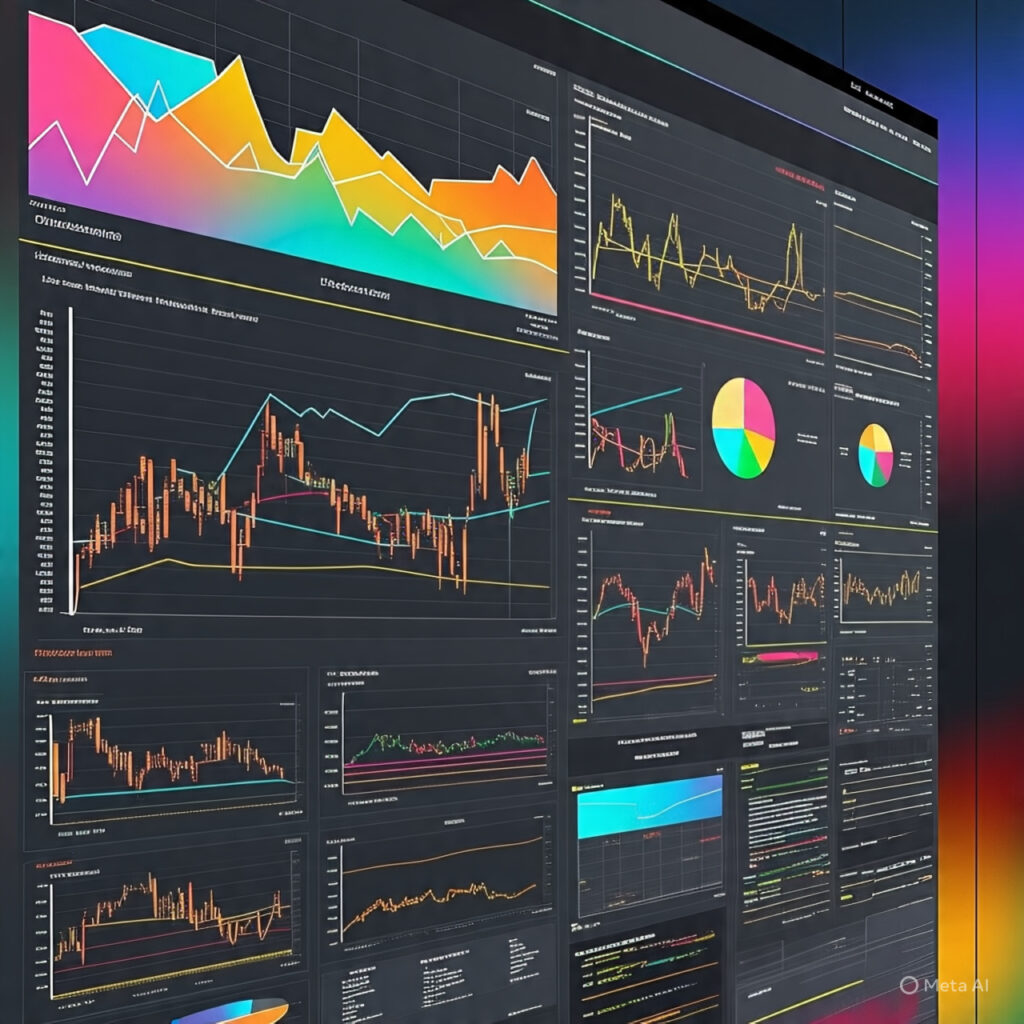
The core of this project is an NLP-powered sentiment analysis engine, built using the VADER sentiment analyzer—a rule-based model specifically attuned to sentiments expressed in social media and product reviews. The dashboard allows users to input text data (manually or in bulk) and see instant analysis, including sentiment polarity (positive, neutral, negative), compound scores, and overall trends.
Users can upload a CSV file containing customer feedback or product reviews, and the system processes each entry, assigns sentiment scores, and visualizes the results through bar charts, pie charts, and time series trends. The interface is developed using Streamlit, offering a smooth and responsive experience in a browser environment.
Key Highlights
- Implemented real-time sentiment scoring using VADER on short and long text entries.
- Developed dynamic visualizations using Plotly for interactivity—users can hover, zoom, and filter charts.
- Enabled batch analysis of reviews through CSV uploads with auto-processing.
- Displayed a summary dashboard showing total sentiment distribution and sentiment over time.
Learned/Achieved
This project helped me understand the intricacies of sentiment lexicons and how rule-based methods like VADER differ from machine learning models. While VADER is not trained on specific datasets, its speed and accuracy on short-form content (like tweets or product reviews) make it highly effective for quick, interpretable results.
I also improved my skills in building data pipelines, from text ingestion to NLP processing and visual output. I explored how to clean textual data using NLTK, including tokenization, stopword removal, and lemmatization—critical steps to ensure accurate sentiment predictions.
From a UI/UX perspective, working with Streamlit and Plotly gave me experience in designing dashboards that are not only functional but also visually appealing. I focused on building an interface that even non-technical users could navigate comfortably. Features like drag-and-drop CSV upload and dynamic chart updates were added based on user feedback.
Another key learning was understanding how businesses use opinion mining to shape marketing strategies, product development, and customer support. By simulating real-world datasets, I saw how even simple sentiment dashboards can lead to actionable insights.
Future Plans
Looking ahead, I aim to expand the dashboard with multi-language sentiment support and custom lexicon training for domain-specific use (e.g., healthcare, finance, politics). I also plan to integrate BERT-based models for more nuanced analysis of long-form content or sarcasm, which rule-based models often miss.
Lastly, I’m working on adding real-time data fetching capabilities from sources like Twitter or news APIs, allowing users to perform live monitoring of public sentiment around trending topics or brand mentions—making this tool a powerful resource for marketing, PR, and data science teams alike.